Lakeshore East Is Moving Faster in 2026
What the January to July numbers say about the condo market
If you have been watching the Lakeshore East condo market this year, the story is not as simple as "prices are up" or "inventory is low." The better takeaway is this:
More homes are selling, they are moving faster, and sellers are capturing a stronger share of their asking price than they did during the same period last year.
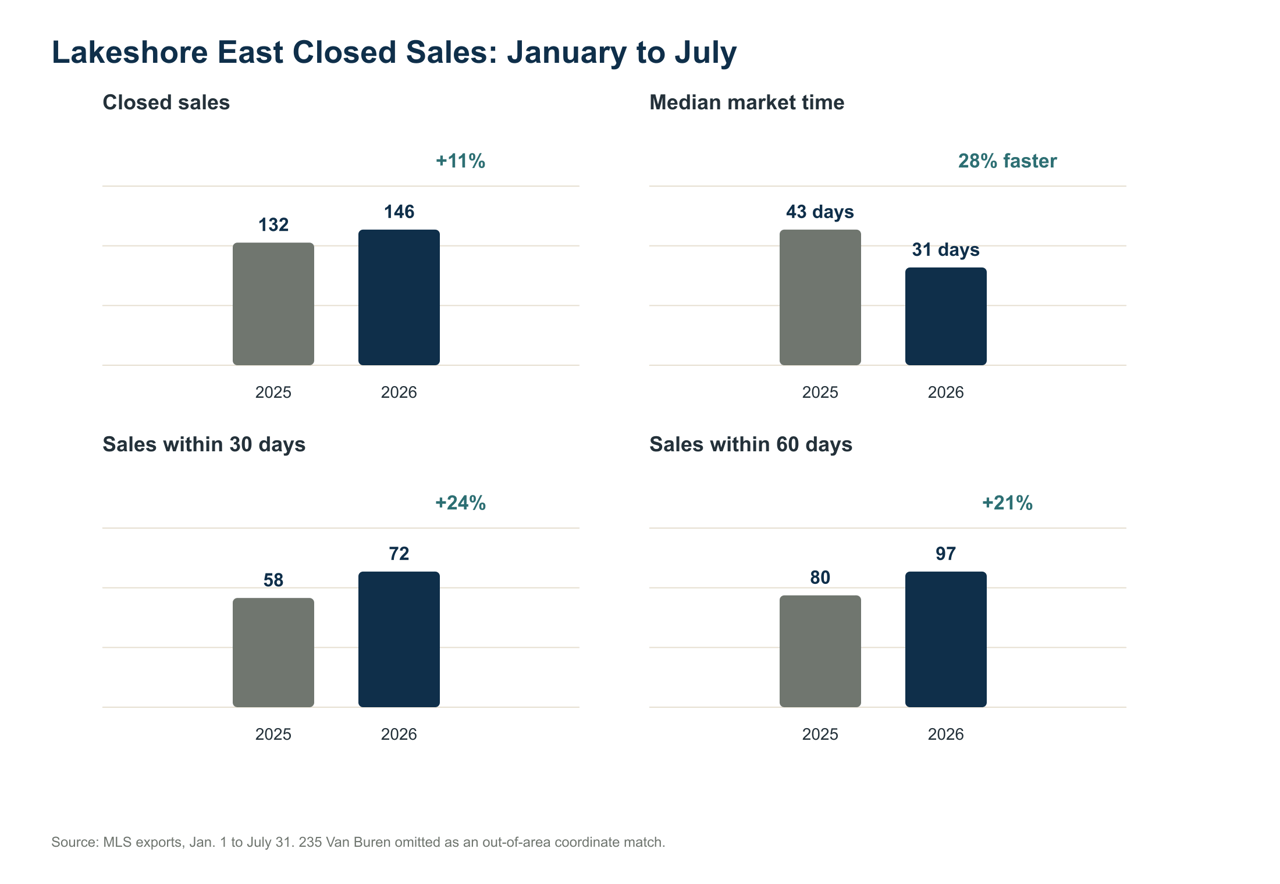
From January 1 through July 31, Lakeshore East recorded 146 closed condo sales in 2026, compared with 132 closed sales during the same period in 2025. That is an 11% increase in closed sales year over year.
The speed of the market changed even more noticeably. Median market time fell from 43 days in 2025 to 31 days in 2026, which means the median Lakeshore East condo sale happened about 28% faster this year.
The Headline Numbers
| Lakeshore East closed sales | Jan to July 2025 | Jan to July 2026 | Change |
|---|---|---|---|
| Closed sales | 132 | 146 | +11% |
| Median market time | 43 days | 31 days | 28% faster |
| Sales within 30 days | 58 | 72 | +24% |
| Sales within 60 days | 80 | 97 | +21% |
| Median sale-to-list price | 97.2% | 97.8% | Improved |
| Median sold price per square foot | $427 | $428 | Essentially flat |
The pricing story needs a little context. Median sold price and average sold price were lower in the overall year-over-year comparison, but that does not mean every segment of the market weakened. The mix of what sold changed. In 2026, the closed sales skewed slightly smaller, and the luxury/newer-construction segment behaved differently from the rest of the resale market.
That is why the market looks clearer when we separate out 363 E Wacker, which has a very different price point and inventory profile than most Lakeshore East resale buildings.
Want to see the individual sales behind these numbers?
View the building-by-building Lakeshore East closed sales breakdown here.
The Core Resale Market Looks Stronger
When 363 E Wacker is removed from the comparison, the Lakeshore East resale market shows a stronger and more useful trend for most neighborhood owners:
| Core resale market, excluding 363 E Wacker | Jan to July 2025 | Jan to July 2026 | Change |
|---|---|---|---|
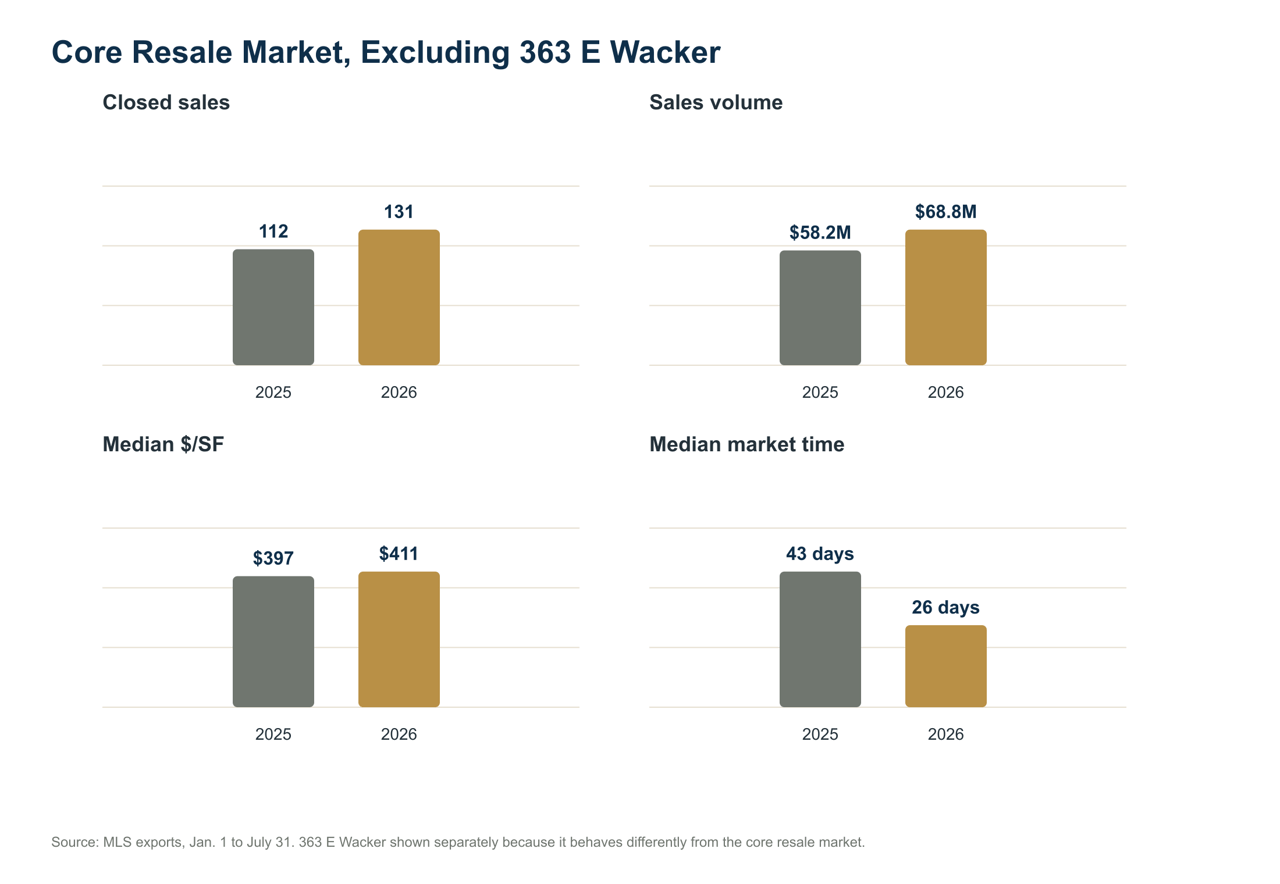
| Closed sales | 112 | 131 | +17% |
| Sales volume | $58.2M | $68.8M | +18% |
| Median sold price | $432,500 | $440,000 | +2% |
| Median sold price per square foot | $397 | $411 | +3.4% |
| Median market time | 43 days | 26 days | 40% faster |
This is the most important part of the story. In the core resale market, more condos sold, total volume increased, median price per square foot improved, and market time dropped sharply.
That does not mean every condo will sell instantly or that pricing strategy no longer matters. It does mean that buyers were more active in the first seven months of 2026, and well-positioned listings had a better chance of moving quickly.
Current Inventory
As of August 11, 2026, Lakeshore East has:
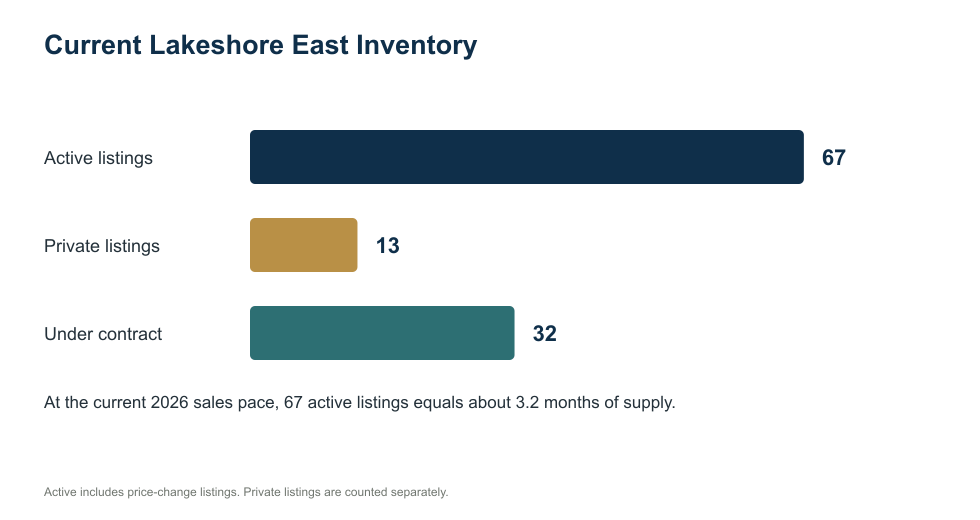
- 67 active listings, including listings with recent price changes
- 13 private listings
- 32 under contract listings
At the January to July 2026 sales pace, the 67 active listings represent about 3.2 months of supply. If we include the 13 private listings, supply is about 3.8 months.
That is not a shortage market, but it is not a stalled market either. With 32 homes under contract, buyers are still writing offers even with more choices available.
Building by Building Snapshot
Small sample sizes matter at the building level, so these numbers should be read as a snapshot rather than a precise valuation tool. One large sale, one studio, or one high-floor home can move a building's median significantly.
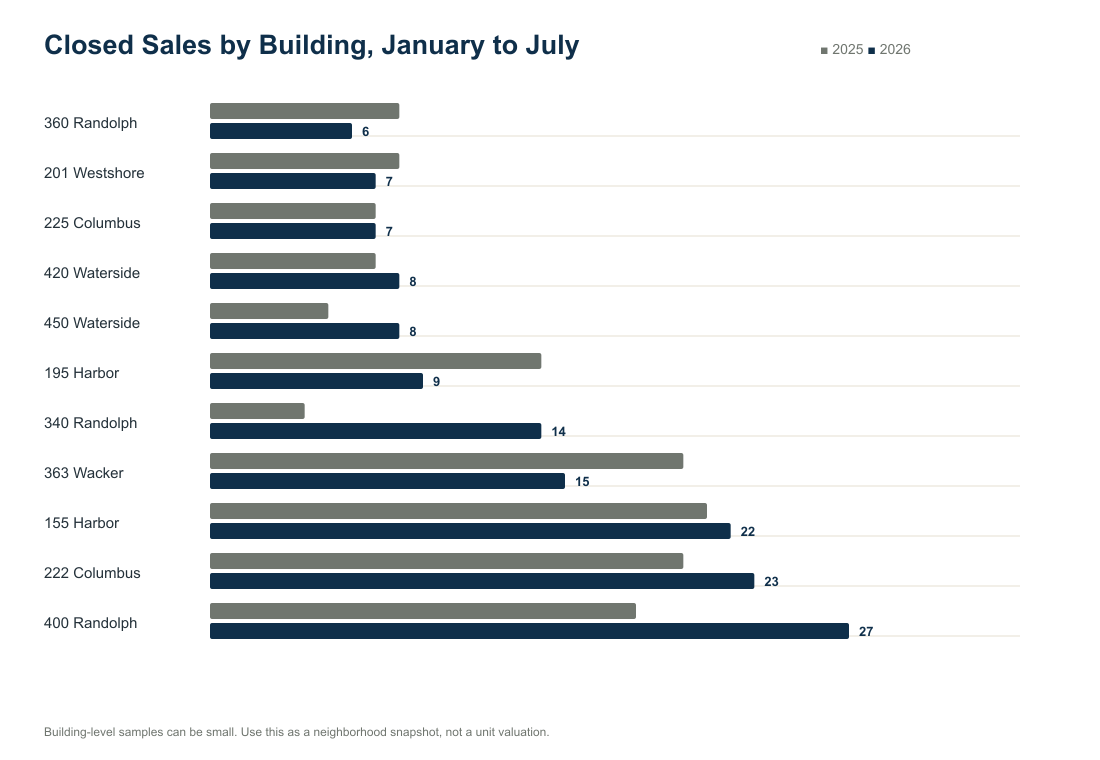
| Building | 2025 closed | 2026 closed | Change | 2026 median sold | 2026 median $/SF | 2026 median market time | Active and private | Under contract |
|---|---|---|---|---|---|---|---|---|
| 400 Randolph | 18 | 27 | +9 | $349,000 | $405 | 30 days | 6 | 2 |
| 222 Columbus | 20 | 23 | +3 | $295,000 | $355 | 26 days | 9 | 7 |
| 155 Harbor | 21 | 22 | +1 | $405,000 | $396 | 29 days | 8 | 5 |
| 363 Wacker | 20 | 15 | -5 | $1,950,000 | $929 | 170 days | 23 | 6 |
| 340 Randolph | 4 | 14 | +10 | $770,000 | $550 | 31 days | 6 | 1 |
| 195 Harbor | 14 | 9 | -5 | $448,500 | $377 | 32 days | 5 | 3 |
| 420 Waterside | 7 | 8 | +1 | $687,500 | $484 | 27 days | 2 | 1 |
| 450 Waterside | 5 | 8 | +3 | $545,000 | $485 | 9 days | 2 | 0 |
| 201 Westshore | 8 | 7 | -1 | $473,000 | $505 | 8 days | 4 | 1 |
| 225 Columbus | 7 | 7 | 0 | $610,000 | $530 | 39 days | 8 | 4 |
| 360 Randolph | 8 | 6 | -2 | $541,250 | $438 | 25 days | 4 | 2 |
For a closer look at your building, I also put together the individual closed sales by Lakeshore East building for January to July 2025 and January to July 2026. View all the closed sales by building here.
The inventory file also shows active or private listings at 194 N Park, 204 N Park, and 208 N Park, which are the Aqua Parkhomes. There were no closed sales for those addresses in either the January to July 2025 or January to July 2026, so they are not included as year-over-year sales comparisons. A closing at 409 E Benton occurred after this January to July reporting window and would belong with the parkhomes on the southeast side of the park.
What This Means if You Own in Lakeshore East
The first seven months of 2026 suggest a more active Lakeshore East condo market than we saw during the same period last year. The broad market had more closings and faster median market time. The core resale market, excluding 363 E Wacker, showed an even stronger improvement in closed sales, volume, price per square foot, and speed.
For owners, the takeaway is encouraging but not automatic. Buyers are active, but they are still selective. Pricing, presentation, building competition, view tier, floor height, parking, and unit condition all matter. And once an offer comes in, the outcome can depend on much more than price. Negotiation is one of the most important - and often overlooked - skills a Lakeshore East seller should consider when choosing representation.
The most successful listings are not just "on the market." They are positioned correctly from day one. See what that looks like in practice: Why Correctly Priced Units in the New Eastside Are Gone in Days.
If you're considering selling, understanding the market is only part of the equation. Here's what Lakeshore East owners should look for when choosing the Realtor who will represent their property.
Data Notes
This analysis is based on Lakeshore East MLS exports for closed condo sales from January 1 through July 31, 2025 and January 1 through July 31, 2026, plus a current 2026 inventory export. For readability, I grouped the inventory into active listings, private listings, and under contract listings. One 235 Van Buren closing appeared in the coordinate-based export but was omitted from the analysis because it is outside Lakeshore East and appears to have been pulled in by incorrect listing coordinates.
Market time, price per square foot, and sale-to-list calculations are based on the fields included in the MLS exports. Records with zero reported square footage were excluded from price-per-square-foot calculations. Building-level statistics use small samples in some cases and should be interpreted as directional rather than as a substitute for a unit-specific valuation.